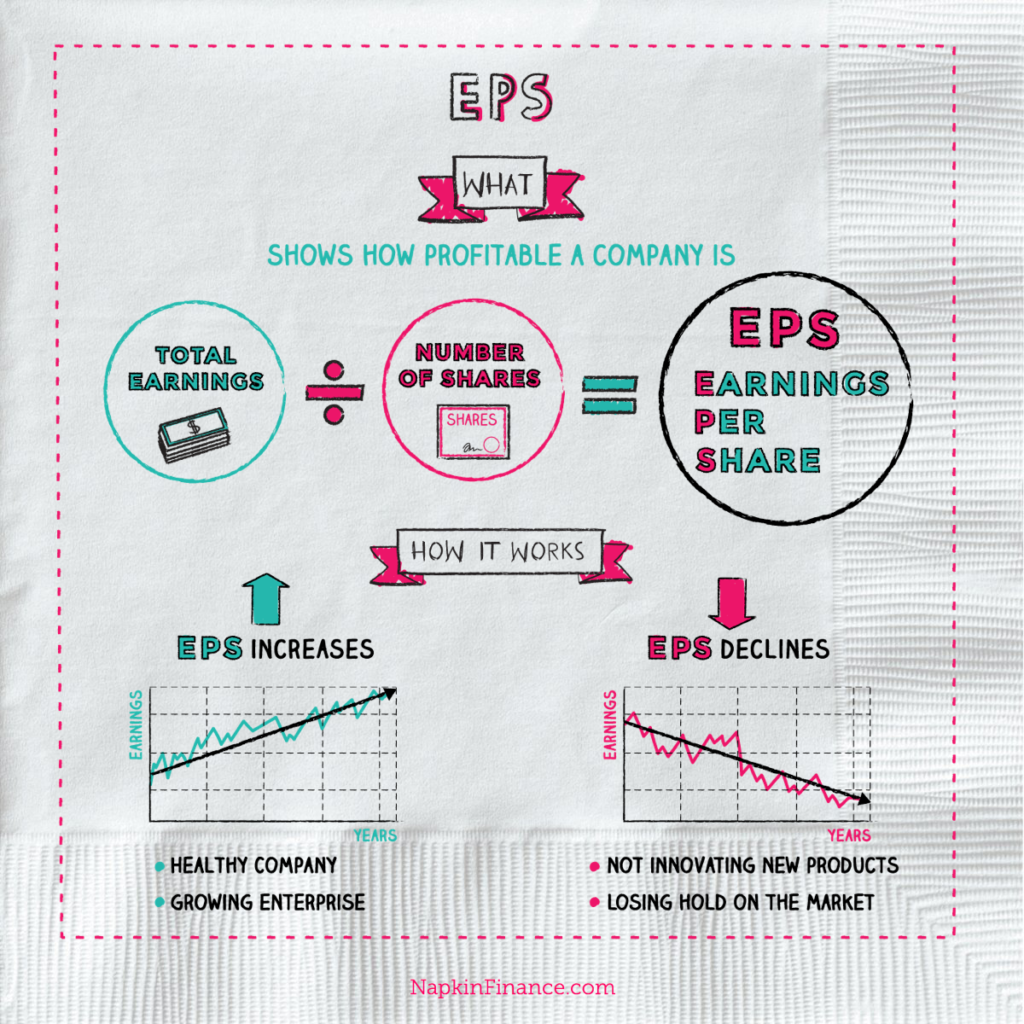
In the financial world, earnings per share (EPS) is a commonly used phrase, particularly in the stock market. Earning per share represents a portion of a company’s profit that is allocated to one share of stock. Therefore, if you were to multiply the EPS by the total number of shares a company has, you would calculate the company’s net income. EPS is an essential calculation for many people who watch the stock market and they need to pay attention to.
Earnings per share (EPS) is the portion of a company’s profit that is allocated to each outstanding share of common stock, serving as a sign or indicator of the company’s profitability. It is often considered to be one of the most important factors in determining a stock’s value, and it comprises the “E” part of the P/E (price-earnings) valuation ratio. EPS is calculated as:
EPS = net income ÷ average outstanding common shares
For instance, S&P Global Inc. (SPGI) has reported in fiscal year 2016 the net income of $2.11 billion and had 265.2 million average shares outstanding. Thus, investors can calculate the EPS as:
EPS = $2.11 billion ÷ 265.2 million = $7.94
Companies may decide to purchase back their own shares in the open market. In doing so, a company can improve its EPS (because there are fewer shares outstanding) without actually improving net income. For example, if SPGI had used a share buy-back program to buy 100 million shares, its EPS would have been:
EPS = $2.11 billion ÷ 165.2 million = $12.75
Some companies have a special class of stock called preferred stock. Any dividends paid on preferred stock would be subtracted from net income when calculating EPS. The formula for calculating EPS would then be:
EPS = (net income – dividends on preferred stock) / average outstanding common shares
In the example above, SPGI had an EPS of $7.94 for the fiscal year of 2016. Knowing the EPS of an individual stock is not adequate information to make an informed investment decision. EPS becomes significant and meaningful when investors examine at historical EPS figures for the same company, or when they evaluate EPS for companies within the same industry. SPGI, for instance, is in the Business Services industry, so investors could consider the EPS of other stocks within that industry, such as Moody’s Corporation (MCO). Since EPS is only one number, it is important to use it in conjunction with other measures before making any investment decisions.
What does the EPS tell us?
Earnings per share are commonly considered to be the single most central variable in concluding a share’s price. The series of tendency of EPS will also inform us whether the company is growing or declining.

napkinfinance.com
EPS is also a key component used to determine the price-to-earnings valuation ratio. For instance, assume that a company has a net income of $25 million. If the company pays out $1 million in preferred dividends and has 10 million shares for half of the year and 15 million shares for the other half, the EPS would be $1.92 (24/12.5). First, the $1 million is deducted from the net income to get $24 million, then a weighted average is taken to find the number of shares outstanding (0.5 x 10M+ 0.5 x 15M = 12.5M).
A key aspect of EPS that is frequently neglected is the capital that is required to generate the earnings (net income) in the calculation. Two companies could produce the same EPS number, but one could do so with less equity (investment) – that company would be more efficient at using its capital to generate income and, all other things being equal, would be a “better” company. Investors also need to be conscious of earnings manipulation that will affect the quality of the earnings number. It is imperative not to depend on only one financial measure, but to use it in combination with statement analysis and other measures.


