In the stock trading, when it comes to technical analysis strategies, few have proven as popular and controversial as the Elliott Wave Principle. Elliott Wave Principle has been used by some of the most successful traders on Wall Street and shrugged off by others.
Elliott Wave was developed by market forecaster Ralph Nelson Elliott in the late 1930s and described in his 1938 book The Wave Principle. Elliott believed that markets inclined to follow a repeating pattern that was driven by investor psychology. Despite the changes taking place in market conditions, Elliott’s research suggested that investors were eventually repeating the same boom and bust cycle over and over again.
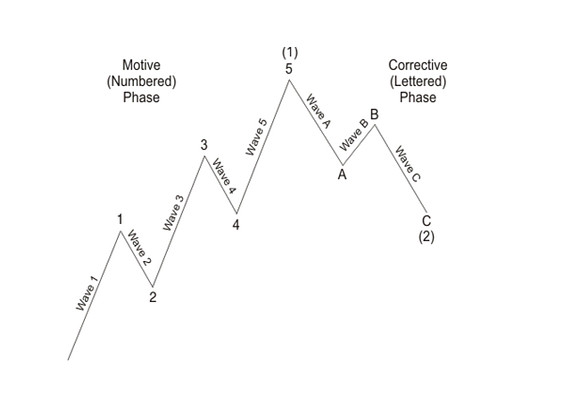
The Elliott Wave pattern is a structure that defines how a stock behaves. All stocks tend to move in a basic five wave structure that consists of a motive phase and a corrective phase.
Under Elliott Wave theory, the most basic pattern of market progress is the motive wave, which is subdivided into five waves and usually labelled by technicians with numbers. Three of those waves (1, 3 and 5) move in the direction of the underlying trend, or impulse, while the two intervening waves (2 and 4) act as countertrend interruptions, or retracements, of the motive wave.
According to Elliott Wave International (EWI), at any time, the market may be identified as being somewhere in the basic five-wave pattern at the largest degree of a trend. Because the five wave pattern is the overriding form of market progress, all other patterns are subsumed by it.
There are certain “rules” that govern the five-wave pattern:
- Wave 4 cannot enter the territory of Wave 1, according to EWI. If it does, the market’s latest move must be part of a larger motive wave, which could be progressing higher or lower.
- Wave 2 can’t retrace more than 100% of Wave 1, according to the Market Technicians Association. If it does, then Wave 2 might not be a corrective wave as originally thought, and could actually be moving in the direction of a motive wave to a larger degree.
- Wave 3, which often represents the strongest part of the market cycle, can’t be the shortest by price, compared with Wave 1 or Wave 5.

http://www.marketwatch.com/story/5-charts-to-help-unravel-the-elliott-wave-mystery-2015-06-08
A complete cycle of wave development actually consists of eight waves, made up of two phases: 1) a wave subdivided into five waves and 2) a three-wave corrective wave.
The corrective wave, usually labelled by technicians by letters, consists of two waves (A and C) that move in the opposite direction of the motive wave, and an intervening retracement wave (B) that moves in the same direction of the motive wave.
One key rule for the simple, zigzag corrective phase is that, in a bull market, Wave B ends noticeably lower than where Wave A starts. The opposite is true in a bear market.
“In summary, the essential underlying tendency of the Wave Principle is that action in the same direction as the one larger trend develops in five waves, while reaction against the one larger trend develops in three waves, at all degrees of a trend,” according to EWI.

http://www.marketwatch.com/story/5-charts-to-help-unravel-the-elliott-wave-mystery-2015-06-08
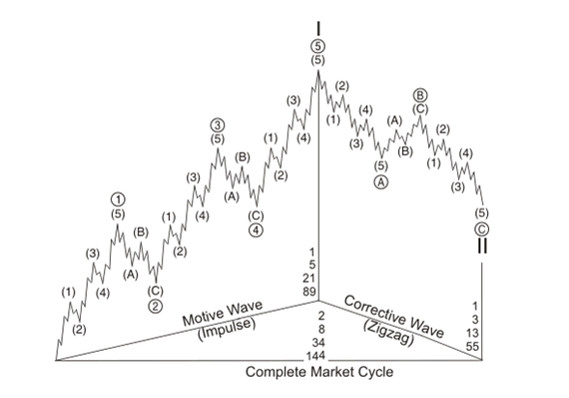
One of the keys to interpreting wave counts is to determine what degree the wave in question represents.
As the above chart shows, each wave could be part of another wave of a higher degree, which in turn could be part of another wave of an even higher degree.
For example, a corrective Wave (A) could be the beginning of a countertrend Wave 4 pullback of a 5-wave uptrend to a larger degree.
“The Wave Principle, then, reflects the fact that waves of any degree in any series always subdivide and re-subdivide into waves of lesser degree and simultaneously are components of waves of higher degree,” EWI explains.
In Elliott’s original work, he identified nine degrees of waves, that could range from decades to intraday movements. His labels read a little like the classification of living things such as Grand Supercycle, Supercycle, Cycle, Primary, Intermediate, Minor, Minute, Minuette and Subminuette.
The present consensus among the trading community is that Elliott Wave is a valuable description of market behavior, but a less useful tool for actively trading the markets. Elliott Wave Theory’s ability to describe the markets after the fact can add considerable commentary to any trader’s strategy. For that reason, it’s certainly worth understanding.


