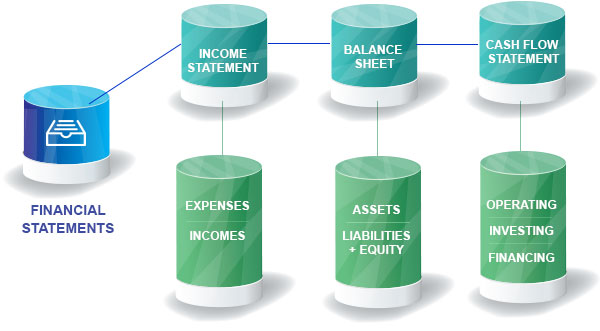
In order to examine a company, it can be done by going through its financial statement. Financial statement analysis is a remarkably powerful tool for various of stakeholders and users of financial statements, each having different objectives in learning about the financial circumstances of the entity.
There are a number of users of financial statement analysis. They are investors both current and prospective; they learn about the company’s ability to maintain issuing dividends, or to make cash flow, or to keep on growing at its historical rate. Company management’s is continuously utilizing ongoing analysis of the company’s financial results, particularly in relation to a number of operational metrics that are not seen by outside entities (such as the cost per delivery, cost per distribution channel, profit by product, and so forth).
Another party that interested to examine the financial statements of a company is the creditor or anyone who has give funds to a company is interested in its ability to pay back the debt and so will focus on various cash flow measures. Lastly, regulatory authorities desire to see the company’s financial statement to conform various standards such as accounting standards, tax and tax reporting etc.
There are three basic financial statements that can be found in the annual and quarterly reports of a company. They are the income statement, balance sheet and cash flow statement—the three pillars of financial statement analysis.

https://www.kotaksecurities.com
Methods of Financial Statement Analysis
Financial statement analysis involves the identification of the following items for a company’s financial statements over a series of reporting periods. Within the financial statement, we can analyze various trends for key items over multiple periods of time to see the company performing. The key items are such as revenues, the gross margin, net profit, account receivable and debt. This can be done horisontally or vertically.
Horizontal analysis is the comparison of financial information over a series of reporting periods, while vertical analysis is the proportional analysis of a financial statement, where each line item on a financial statement is listed as a percentage of another item. The horizontal analysis is the review of the results of multiple time periods, while vertical analysis is the review of the proportion of accounts to each other within a single period.
In addition to that information in the financial statement can be use for proportion analysis. An array of ratios is available to recognize the relationship between the size of various accounts in the financial statements. For example, you can measure a company’s quick ratio to estimate its ability to pay its immediate liabilities, or its debt to equity ratio to see if it has taken on too much debt. These analyses are frequently between the revenues and expenses listed on the income statement and the assets, liabilities, and equity accounts listed on the balance sheet. After you calculate a ratio, you can then compare it to the same ratio calculated for a prior period, or that is based on an industry average, to see if the company is performing in accordance with expectations.
Quick analysis
If you have limited time, it is wise to look at specific key aspects that assist you to understand a company’s financial position.
Net income
It is a good indicator of profitability because it puts a value on the amount a company takes in once all costs of production, depreciation, tax, interest and other expenses have been deducted. The complete information can be found in the company’s income statement.
Operating profit margin
Operating profit margin is another important indicator of profitability and efficiency. The operating profit margin compares the amount a company earns before interest and taxes to the amount it generates in sales. The margin helps analysts and potential investors understand how successful a company’s managers are at controlling expenses and generating profitable revenue from the company’s business operation. A high operating profit margin is a strong indication that a company is managing its costs well and that it is generating sales at a faster rate than costs are rising.
Earnings per share
If you need to assess the company’s stock price and profitability for shareholders, one indicator that can be used is EPS. Earnings per share (EPS) is an indicator of return on investment, showing a company’s per share profitability. The price-earnings (P/E) ratio uses a stock’s EPS compared to its present share price for evaluation purposes. The price to book (P/B) ratio is considered a foundational value metric for investors, as it reveals the market’s valuation of the company in relation to its intrinsic value.
Dividend payout ratio
The dividend payout ratio is another useful metric, one that provides a measure of a company’s growth, financial stability and returns paid to stockholders. The dividend payout ratio calculates the percentage of company earnings that is being paid out to equity investors in the form of dividends. The higher the ratio value, the more reliable a company’s earnings can manage to sustain dividend payouts and the more stable a company is considered to be. Retained earnings, a number of profits not paid out to shareholders as dividends, shows what portion of profits a company is reinvesting in expanding its business.
Debt ratios
Debt ratio can assist you to give description debt situation through company balance sheet. Debt ratios, such as the current ratio, that can be calculated from the information provided in financial statements enable analysts to assess a company’s ability to handle its outstanding debt. In the company balance sheet not only debt, asset, liabilities as well as major capital expenditures are shown and it can be used in evaluating a company’s current financial condition and its potential for growth.


